I think Kalman filter is the gradient descent of the control system world!

Problem Statement : Track the state(position) of the object moving at a constant velocity.

Scenario :You drive with your car in a tunnel and the GPS signal is lost. Now the car has to determine, where it is in the tunnel. The only information it has, is the noisy measurement of its velocity in driving direction. The x and y component of the velocity (x˙ and y˙) can be calculated from the absolute velocity (revolutions of the wheels) and the heading of the vehicle (yaw rate sensor).

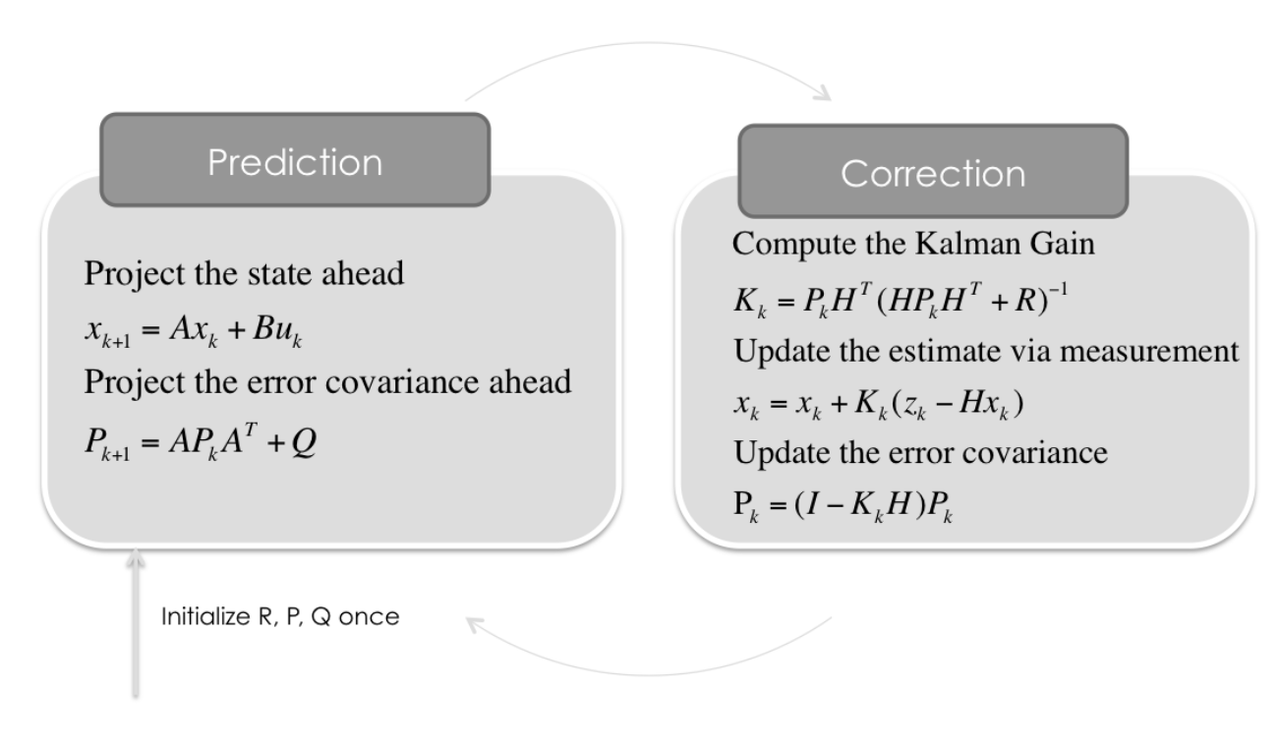
Methodology : Use Kalman filters. Kalman filter is an algorithm for estimating the state of the system for example speed and position of the car using past and possibly noisy observations and current possibly noisy measurements of the system

Credits :The notebook is based on the following video

Imports

import numpy as np
import matplotlib as mpl
from matplotlib import pyplot as plt

Data and Parameters

Synthetically generate noisy measurements of constant veclocity in the two directions.

Number of measurements

m = 100

velocity in x and y directions

vx = 20
vy = 10

Add random noise to each constant velocity measurement

mx = np.array(vx + np.random.randn(m))
my = np.array(vy + np.random.randn(m))
measurements = np.vstack((mx,my))
measurements
array([[19.18199113, 19.60261424, 19.32473278, 20.12852329, 19.52369446,
        19.82546316, 19.06530783, 19.71584217, 18.98359359, 19.3511552 ,
        20.59768421, 18.6762028 , 20.10370297, 19.34737904, 18.85925546,
        20.04053824, 19.666659  , 19.8294875 , 20.60267812, 19.26751258,
        21.00369316, 21.174452  , 20.10650566, 18.81306794, 19.77758407,
        18.99368314, 18.72884021, 20.94424653, 19.81926115, 19.38409701,
        18.62335228, 19.22830253, 21.49077775, 21.20593409, 18.89539579,
        21.39367392, 20.86408409, 19.37585653, 20.98341741, 20.62395896,
        19.50720261, 20.275245  , 19.76221664, 18.82291059, 19.33142931,
        19.73368244, 21.68614649, 19.65439569, 19.62773894, 19.52972908,
        20.08991476, 18.45097066, 20.73256885, 20.16034379, 19.23471851,
        20.6325844 , 20.39147966, 19.55833639, 21.35074911, 20.83077009,
        19.20000411, 19.86332946, 19.49645957, 21.17023862, 21.13986568,
        20.67177091, 21.10954083, 19.8804764 , 20.85039946, 20.82658322,
        21.58162223, 20.4770023 , 18.80738633, 20.95726542, 20.05465047,
        20.08725368, 18.47539485, 18.24079446, 20.252773  , 19.55652348,
        19.46998851, 19.83214639, 22.13787482, 18.82270259, 22.14045505,
        20.52087147, 20.77137805, 20.00188037, 19.75945835, 20.90742125,
        20.6434509 , 20.79799423, 19.73688161, 19.46605566, 19.15541015,
        20.28386053, 23.33689359, 19.70271146, 19.04375873, 20.45089215],
       [10.92048931,  9.8863825 ,  8.86822177, 10.59282149, 10.11877421,
        11.3798237 ,  8.06622975, 10.06728227,  9.97189956, 11.39169522,
         8.42294765,  8.81097704, 10.42235895,  9.63462592,  9.72772483,
        11.11578141, 10.45465692, 10.32790723,  9.91878333, 12.59486868,
        10.89286265, 10.81624795,  9.72672587, 11.81031635,  8.42605262,
        10.03565605,  9.72044743, 10.1369021 ,  9.65486931, 10.47236949,
         8.13788994,  9.64408753,  8.6390424 , 10.3771825 ,  9.16922205,
        10.16954616,  9.11870002, 11.15704648,  8.95889076,  9.13370211,
        11.798778  , 10.8115414 , 10.14513063, 10.5667429 ,  9.02247277,
        11.82303437,  8.95662452, 10.82982073, 12.03799151,  8.72640959,
         9.87481995, 10.12017395, 10.50463769, 10.96067734,  9.24929337,
        10.53206731, 10.47035753, 11.10796151, 10.82243543, 10.35446594,
        10.35956969, 10.59167183,  9.84439971, 10.52009804, 10.30207581,
        10.65396118,  9.1372178 ,  9.93587069, 12.03891181, 10.73426222,
         8.93921963,  9.75706653,  9.74389448, 10.45093319, 11.04315493,
        10.28968005,  8.9661058 ,  9.6043691 ,  9.25281423,  9.29747955,
        11.4208568 ,  8.48332818,  9.97810659,  9.62025616,  9.32552378,
         9.31716574, 10.62222332,  9.13736011,  9.65248014,  9.7888286 ,
        12.41077194,  8.33794753, 10.46855703,  8.77296165,  8.22390735,
        10.56812338,  9.66273854, 11.07476392,  8.56549026,  9.53474445]])
Visualise the data

plt.figure(figsize=(10,7))
plt.plot(range(m),mx, label='$v_1 (measurements)$')
plt.plot(range(m),my, label='$v_2 (measurements)$')
plt.ylabel('Velocity Measurements')
plt.title('Noisy Measurements')
plt.legend(loc='best',prop={'size':15})

plt.show()

Initializing Variables

SCR-20220908-qnm.png

These are dynamic matrices

dt = 0.1

# Identity matrix
I = np.eye(4)

# state matrix
x = np.matrix([[0.0, 0.0, 0.0, 0.0]]).T

# P matrix
P = np.diag([1000.0, 1000.0, 1000.0, 1000.0])

# A matrix
A = np.matrix([[1.0, 0.0, dt, 0.0],
                [0.0, 1.0, 0.0, dt],
                [0.0, 0.0, 1.0, 0.0],
                [0.0, 0.0, 0.0, 1.0]])

# H matrix
H = np.matrix([[0.0, 0.0, 1.0, 0.0],
            [0.0, 0.0, 0.0, 1.0]])

# R matrix
r = 100.0
R = np.matrix([[r, 0.0],
            [0.0, r]])


# Q, G matrices
s = 8.8
G = np.matrix([[0.5*dt**2],
            [0.5*dt**2],
                [dt],
                [dt]])
Q = G*G.T*s**2

Kalman Filtering Algorithm

The Following variables will store the results, at each iteration

xt = []
yt = []
dxt= []
dyt= []
Zx = []
Zy = []
Px = []
Py = []
Pdx= []
Pdy= []
Rdx= []
Rdy= []
Kx = []
Ky = []
Kdx= []
Kdy= []

Algorithm in process

for n in range(len(measurements[0])):
    
    # Prediction
    # state prediction
    x = A*x
    
    # error covariance prediction
    P = A*P*A.T + Q
    
    # Update Steps
    # Kalman Gain
    S = H*P*H.T + R
    K = (P*H.T) * np.linalg.pinv(S)
    
    # Update the estimate via z
    Z = measurements[:,n].reshape(2,1)
    y = Z - (H*x)
    x = x + (K*y)
    
    # error covariance
    P = (I - (K*H))*P
    
    # storing the results
    xt.append(float(x[0]))
    yt.append(float(x[1]))
    dxt.append(float(x[2]))
    dyt.append(float(x[3]))
    Zx.append(float(Z[0]))
    Zy.append(float(Z[1]))
    Px.append(float(P[0,0]))
    Py.append(float(P[1,1]))
    Pdx.append(float(P[2,2]))
    Pdy.append(float(P[3,3]))
    Rdx.append(float(R[0,0]))
    Rdy.append(float(R[1,1]))
    Kx.append(float(K[0,0]))
    Ky.append(float(K[1,0]))
    Kdx.append(float(K[2,0]))
    Kdy.append(float(K[3,0]))


Kalman Gains

def plot_K():
    fig = plt.figure(figsize=(16,9))
    plt.plot(range(len(measurements[0])),Kx, label='Kalman Gain for $x$')
    plt.plot(range(len(measurements[0])),Ky, label='Kalman Gain for $y$')
    plt.plot(range(len(measurements[0])),Kdx, label='Kalman Gain for $\dot x$')
    plt.plot(range(len(measurements[0])),Kdy, label='Kalman Gain for $\dot y$')

    plt.xlabel('Filter Step')
    plt.ylabel('')
    plt.title('Kalman Gain (the lower, the more the measurement fullfill the prediction)')
    plt.legend(loc='best',prop={'size':22})
plot_K()

Visualising Results

# Our estimates are in Red
plt.figure(figsize=(10,10))
plt.plot(range(len(measurements[0])),dxt, label='$v_1estimate$', c='r')
plt.plot(range(len(measurements[0])),dyt, label='$v_2estimate$', c='r')

# The noisy velocity measurements in both directions are in green and blue.
plt.plot(range(len(measurements[0])),mx, label='$z_1 (noisy Measurement)$', c='g')
plt.plot(range(len(measurements[0])),my, label='$z_2 (noisy Measurement)$', c='b')

# The actual constant velocity for both directions are in black
plt.axhline(vx, color='#999999', label='$v_1(real)$')
plt.axhline(vy, color='#999999', label='$v_2(real)$')
plt.title('Estimates of Velocity')
plt.legend(loc='best')
plt.ylim([0, 30])
plt.show()


# Position Tracking
# Scatter plot of x and y location estimates in black
# these should ideally form a straight line
plt.figure(figsize=(10,10))
plt.scatter(xt,yt, s=30, label='State', c='black')

# starting point in green and end point in red
plt.scatter(xt[0],yt[0], s=100, label='Start', c='g')
plt.scatter(xt[-1],yt[-1], s=100, label='Goal', c='r')
plt.xlabel('$x_1$')
plt.ylabel('$x_2$')
plt.title('Estimates of Position (Tracking)')
plt.legend(loc='best')
plt.show()

End of Notebook